
Pandas Split
I use the open source Python pandas library frequently for data processing and analysis and plotting and all the things.
A function I use often is the GroupBy function, which pandas creator Wes Mckinney defines as a method to “split-apply-combine”. It allows the user to split the data into subsets according to values in a selected array, apply some function on each separate subset, then combine all the data back into an object with the aggregated values.
In essence, we’re performing a map-reduce, where the first two steps (split & apply) are the mapping step and the last step (combine) is the reduce step.
Alright. But the reason I’m writing this lightning post is to share excitement about a functionality of GroupBy I had never seen before.
Here goes.
My use case: I’ll often have a dataset which I’ll want to subset according to values in one or more columns, and manipulate each of the subsets individually.
Groupby solution: Create a dictionary from the GroupBy object!
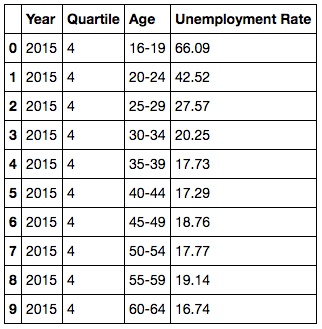
Example: Unemployment data from Spain, years 2013-2015
(Source)
Here are the first 10 rows:
Let’s say I want to subset the data by year. There are a few ways to do this in pandas, but with GroupBy… ONE ELEGANT LINE:
year_subsets = dict(list(new_df.groupby('Year')))
The resulting year_subsets is a dictionary whose keys are years (2013, 2014, 2015) and whose values are DataFrames of rows from said year. For example, year_subsets['2014'] returns a DataFrame object.
There are alternative ways to subset data in pandas, but this is the only one-liner I’ve seen that returns the data in its original format, with its original indices.