MTA Turnstile Analysis
The first project assigned to us at Metis was based on MTA Turnstile Data.

Our task was to help group WTWY in their efforts to optimize their street team in collecting emails from interested parties, in hopes of raising awareness of their organization and eventually maximizing participation and financial contributions.
The turnstile data includes entry and exit counts for each subway station, measured in four hour intervals at inconsistent times. Required significant man-hours to clean and organize the data.
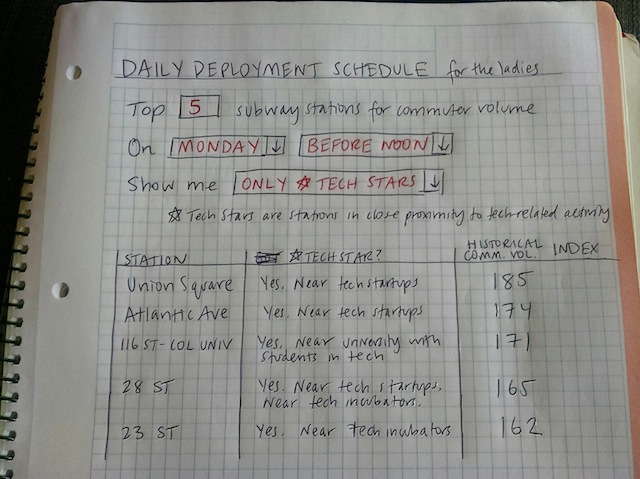
My group proposed the following to the fictional client: an analysis of top stations with highest traffic during the workweek (divided into morning and evening traffic), as well a classification of stations in proximity to tech-related activity. Provided with both, the client could optimize their efforts by deploying their street team at the locations with the greatest and most relevant audience.
In the end, we presented the client with the following proof of concept, where red text are inputs that can be modified by the user.

Here is a copy of the full presentation:
